Have you ever had the moment when your students could find the mean, but then everything after falls apart? You might be watching your students confidently calculate an average, only to freeze when asked what the data really showed. That is exactly where mean absolute deviation can start to feel overwhelming for them. Once I shifted how I introduced mean absolute deviation, everything clicked in a way it hadn’t before, and it can for you, too.
If you are teaching mean absolute deviation for the first time or looking for a refresher, you are not alone in wondering how to break it down. This concept can feel abstract at first, especially for your students who are still building number sense. The good news is that with the right structure and pacing, your students can absolutely understand it. I am going to walk you through exactly how to teach mean absolute deviation in a way that sticks.
Why Mean Absolute Deviation Matters for Your Students
Mean absolute deviation helps your students understand how spread out the data is around the mean. It gives meaning to numbers beyond just finding an average. When your students see how far values are from the mean, they start thinking more deeply about data. This is where real understanding begins to build.

In real life, mean absolute deviation is used more often than we realize. Think about sports statistics, where consistency matters just as much as performance. A player with consistent scores may be more valuable than one with unpredictable results. Mean absolute deviation clearly highlights that difference.
It is also used in fields like finance and science to measure variability. When people analyze trends or predict outcomes, they need to know how reliable the data is. Teaching mean absolute deviation gives your students a foundation for understanding those real-world applications. It moves them beyond basic calculations into true data analysis.
Steps for Teaching Mean Absolute Deviation Clearly
When teaching mean absolute deviation, be sure that your students are confident in finding the mean. Without that foundation, the rest of the process will feel confusing. I always recommend modeling this step slowly and checking for understanding before moving on. This keeps your students from getting lost later.
1. Find the Mean of the Data Set

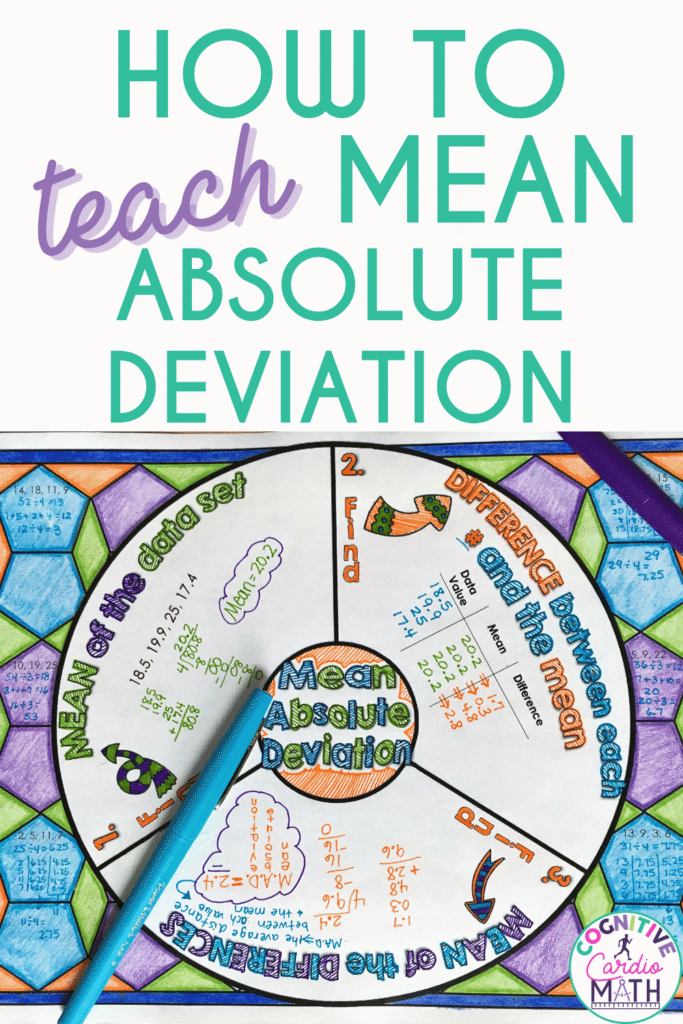
I recommend writing out a small data set and thinking out loud while solving it. Show your students how to add each value carefully and then divide by the total number of values. On my Mean Absolute Deviation Wheel, this is the first section where your students record the data set and calculate the mean.
When using this math wheel, have your students complete this section with you, then turn and explain their steps to a partner. You can always stay here until most of your students can explain why we divide, not just how. A quick check I liked to use was asking, “What would happen if we forgot to divide?” That question quickly showed me who truly understood. Once they are solid here, the rest of the process becomes much smoother.
2. Find the Difference Between Each Number and the Mean
Next, guide your students to find the difference between each data value and the mean. This is where many of your students will need extra support, especially with subtraction. My Mean Absolute Deviation Wheel visually breaks this down step by step into a three-column chart. This is the point where you can slow things down again and model multiple examples. Write one value at a time and subtract the mean, showing every step. Your students may rush here and make small errors that throw everything off later, so have your students line up their subtraction vertically and show their work. You might allow them to use a calculator here since the focus isn’t on subtracting but on finding the MAD.
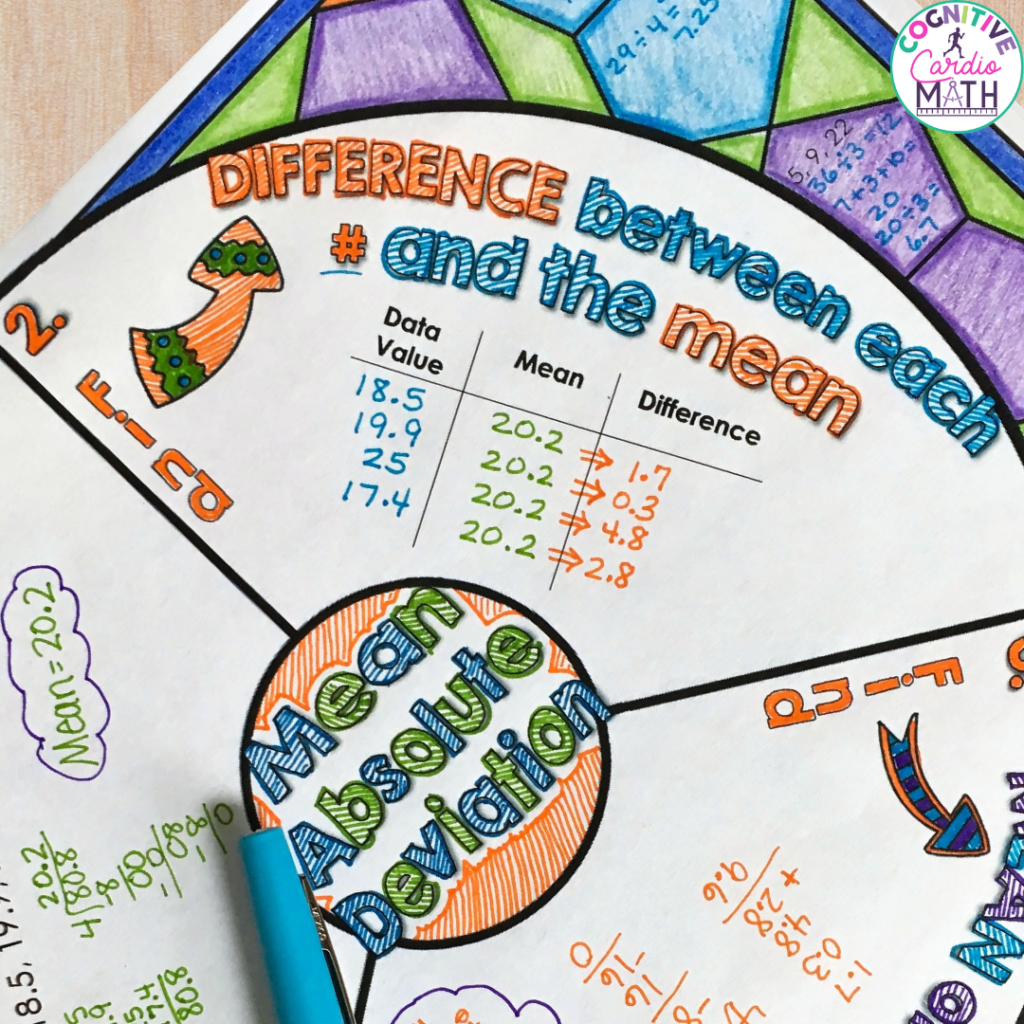
You might be wondering how to keep your students organized during this step. The wheel helps because each value has a clear space for recording its difference. Have your students circle their mean in the first section, so they consistently use the correct number. These small routines make a big difference in accuracy.
You’ll also need to introduce or review absolute value in a simple and approachable way. Your students need to understand that distance from the mean is always positive. I used to describe this as how far away a number is, not which direction. I would ask, “How far is this number from the mean?” rather than “What is the absolute value?” That small shift in language makes a big difference. On the Mean Absolute Deviation Wheel, this connects directly to the differences your students just found.
If you are wondering how to make this click, visuals help a lot. Draw a quick number line and show that distance is always counted positively. Some of your students may need to physically see that movement to understand it. Once they grasp this idea, you can connect it back to absolute value notation.
3. Find the Mean of the Differences
Finally, have your students find the mean of those absolute differences. This is the step that ties everything together and completes the process. Walk through one full example together before letting them practice with a partner or independently.
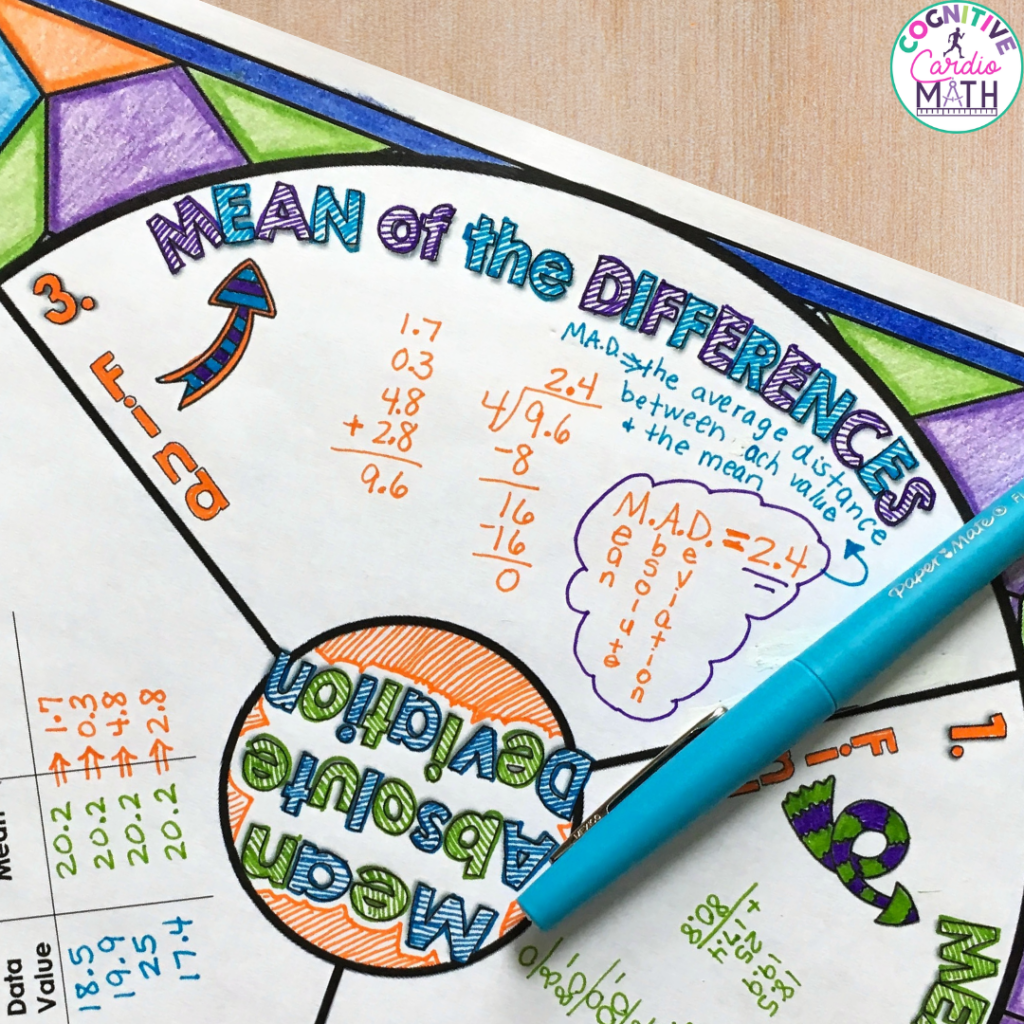
The last section of the Mean Absolute Deviation Wheel focuses on finding the mean of the differences. Be sure to remind your students that they are repeating a skill they already know. This helps reduce the feeling that this is a completely new concept. Add all the absolute differences together and divide by how many there are.
One thing to always clarify here is what the final answer actually represents. Mean absolute deviation tells your students the average distance each value is from the mean. This helps describe how spread out the data is.
To really lock this in, you can show two small data sets and have your students calculate the mean absolute deviation for both. Then compare the results and decide which data set is more consistent. This helps your students see that a smaller mean absolute deviation means the values are closer together, while a larger one signifies they are more spread out.
Quick Tips for Making Mean Absolute Deviation Stick
Once your students understand the steps for mean absolute deviation, give them a simple checklist to use during practice (or they can use the wheel). This helps them slow down and avoid skipping a step. You can have them check off finding the mean, subtracting each value, using absolute value, and finding the final average. That small routine builds accuracy and independence. Once your students have that routine, they can choose to keep using it or keep it nearby to pull out if needed.

Another helpful tip is to have your students label their work as they go. Instead of only writing numbers, encourage them to write words like mean, difference, absolute differences, and mean absolute deviation. You can even have your students color-code each part of the process. For example, they might write the mean in one color, differences in another, and absolute values in a third. This helps your students visually connect each step and makes their work easier to follow and check.
You can also build in quick examples of error analysis. Show your students a worked problem with a common mistake, such as forgetting absolute value or dividing by the wrong number. Then have them find and fix the error with a partner. This gives them practice thinking critically rather than just following steps.
Using the Mean Absolute Deviation Wheel to Support Learning
One of the most helpful tools for teaching mean absolute deviation is a structured visual, such as a math wheel. Instead of feeling like a long list of steps, mean absolute deviation becomes something your students can actually see and follow. The wheel acts as a built-in roadmap that keeps everything organized in one place. Your students won’t be flipping between notes or trying to remember what comes next. That alone can reduce a lot of frustration, especially for your students who struggle with multi-step problems.

What really makes this tool impactful is that it functions as a differentiated graphic organizer, not just a worksheet. Your students are actively building their understanding as they complete each section. They are solving problems and organizing their thinking in a way that makes sense to them. Over time, this helps them internalize the process instead of relying on memorization.
Adding color and doodles takes that learning even further. When your students color-code sections or add simple visuals, they are creating mental connections that help with retention. It gives them something to anchor their thinking to when they revisit the concept later. Even your students who are hesitant with math tend to engage more when the work feels creative and less rigid.
This also turns the wheel into a year-long reference tool rather than a one-time activity. You can have your students add it to their notebooks and come back to it during review or test prep. Instead of asking, “What do we do again?” they have a clear example right in front of them. That independence is huge, especially as the year goes on and concepts start to build.
Take Mean Absolute Deviation Further with Ready-to-Use Support
Teaching mean absolute deviation does not have to feel complicated or overwhelming. When you break it into clear steps and support your students along the way, it becomes much more approachable. Your students will not only learn the process but also understand why it matters. The key is giving them structure, modeling your thinking, and connecting the concept to real situations. This is where structured notes and targeted practice make a huge difference. Instead of reteaching or creating new problems each day, you can give your students consistent opportunities to apply the process in different ways. That repeated exposure is what builds true confidence.
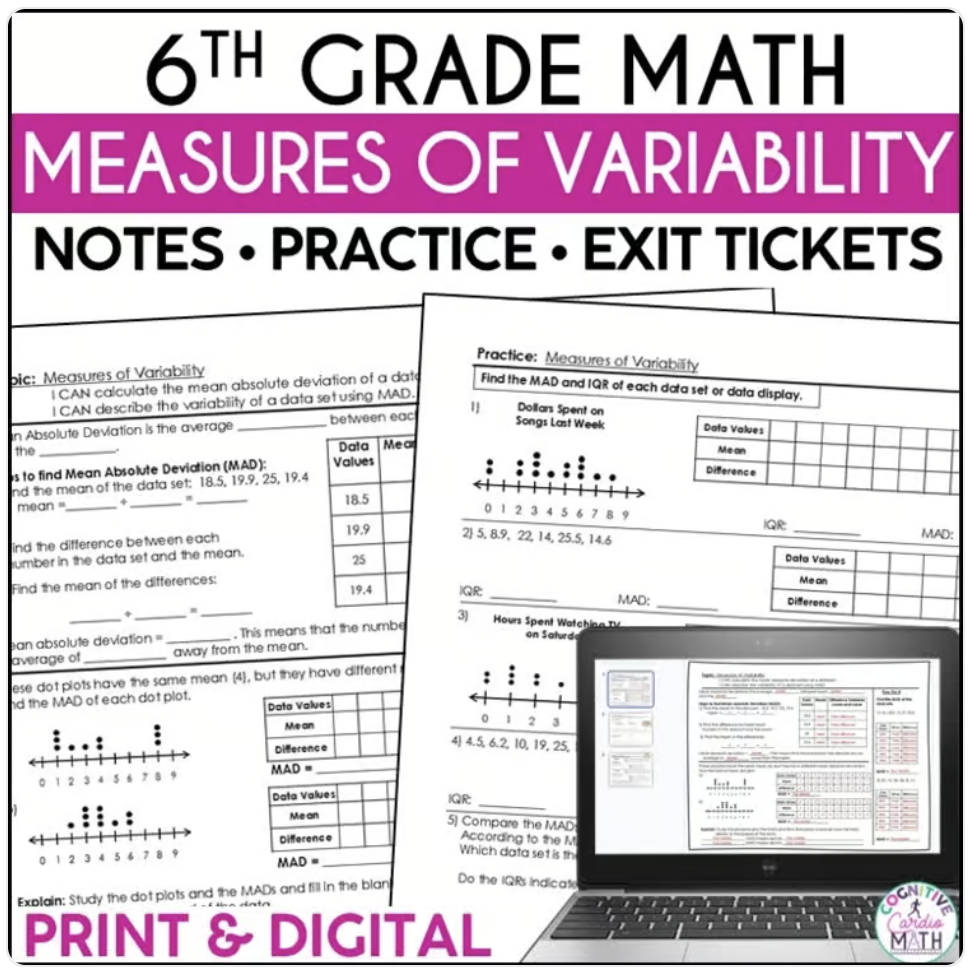
My Mean Absolute Deviation notes and practice pages walk your students through guided examples first, then gradually release them into independent practice. You will have access to guided notes, practice pages, and exit tickets, all in one resource. This makes it easy for you to plan an entire lesson without having to scramble for additional materials.
What makes this especially helpful is how the resource goes beyond just calculating mean absolute deviation. Your students are also asked to interpret what their answers mean and compare data sets. On the guided notes pages, your students explain how mean absolute deviation relates to how spread out the data is. That shift from solving to explaining is where deeper understanding occurs.
Looking for Even More Support?
If you are looking to build out your entire data unit, this is just one piece of a larger collection. Inside my TPT store, you will find additional math wheels, complete math units, review activities, and math centers for a wide variety of math concepts. Having access to those resources means you are not starting from scratch each time you teach a new concept. It allows you to stay consistent while giving your students the support they need.
Save for Later
If you are planning your data unit, this is one strategy you will want to come back to. Save this post so you have a clear roadmap for teaching mean absolute deviation when you need it. Having a plan in place makes all the difference during those lessons!